Login to your system via SSH and become root or a privileged user.
Installation
Create a node-exporter service user:
sudo useradd --system --no-create-home --shell /usr/sbin/nologin node_exporterCreate a /opt/node-exporter folder and change into it:
mkdir /opt/node-exporter
cd /opt/node-exporter/
Download the latest or desired version of node exporter. You can find the latest release here: https://github.com/prometheus/node_exporter/releases/
I am downloading release 1.9.1:
wget https://github.com/prometheus/node_exporter/releases/download/v1.9.1/node_exporter-1.9.1.linux-amd64.tar.gzExtract the archive:
tar -xzvf node_exporter-1.9.1.linux-amd64.tar.gzMove the node_exporter executable into /usr/local/bin:
mv node_exporter-1.9.1.linux-amd64/node_exporter /usr/local/bin/node_exporterChange the group-ownership to our node exporter service user:
sudo chown root:node_exporter /usr/local/bin/node_exporter
sudo chmod 755 /usr/local/bin/node_exporter
Create the service file at /etc/systemd/system/node_exporter.service:
vim /etc/systemd/system/node-exporter.service[Unit]
Description=Node
Exporter After=network.target
[Service]
User=node_exporter
Group=node_exporter
Type=simple
ExecStart=/usr/local/bin/node_exporter
[Install]
WantedBy=multi-user.targetReload Systemctl:
systemctl daemon-reloadStart end enable the service:
systemctl enable node-exporter
systemctl start node-exporter
When looking up the status of the service you should see that it is running and enabled:
root@Rocky10-Template1:~# systemctl status node-exporter
● node-exporter.service - Node
     Loaded: loaded (/etc/systemd/system/node-exporter.service; enabled; preset: disabled)
     Active: active (running) since Thu 2025-08-21 09:43:30 CEST; 2min 31s ago
 Invocation: 31a767d4b9f74478b48b2484f8710578
   Main PID: 2119 (node_exporter)
      Tasks: 4 (limit: 10681)
     Memory: 5M (peak: 5.2M)
        CPU: 7ms
     CGroup: /system.slice/node-exporter.service
             └─2119 /usr/local/bin/node_exporter

Aug 21 09:43:30 Rocky10-Template1.domain.local node_exporter[2119]: time=2025-08-21T07:43:30.870Z level=INFO source=node_exporter.go:141 msg=time
Aug 21 09:43:30 Rocky10-Template1.domain.local node_exporter[2119]: time=2025-08-21T07:43:30.870Z level=INFO source=node_exporter.go:141 msg=timex
Aug 21 09:43:30 Rocky10-Template1.domain.local node_exporter[2119]: time=2025-08-21T07:43:30.870Z level=INFO source=node_exporter.go:141 msg=udp_queues
Aug 21 09:43:30 Rocky10-Template1.domain.local node_exporter[2119]: time=2025-08-21T07:43:30.870Z level=INFO source=node_exporter.go:141 msg=uname
Aug 21 09:43:30 Rocky10-Template1.domain.local node_exporter[2119]: time=2025-08-21T07:43:30.870Z level=INFO source=node_exporter.go:141 msg=vmstat
Aug 21 09:43:30 Rocky10-Template1.domain.local node_exporter[2119]: time=2025-08-21T07:43:30.870Z level=INFO source=node_exporter.go:141 msg=watchdog
Aug 21 09:43:30 Rocky10-Template1.domain.local node_exporter[2119]: time=2025-08-21T07:43:30.870Z level=INFO source=node_exporter.go:141 msg=xfs
Aug 21 09:43:30 Rocky10-Template1.domain.local node_exporter[2119]: time=2025-08-21T07:43:30.870Z level=INFO source=node_exporter.go:141 msg=zfs
Aug 21 09:43:30 Rocky10-Template1.domain.local node_exporter[2119]: time=2025-08-21T07:43:30.870Z level=INFO source=tls_config.go:347 msg="Listening on" address=[::]:9100
Aug 21 09:43:30 Rocky10-Template1.domain.local node_exporter[2119]: time=2025-08-21T07:43:30.870Z level=INFO source=tls_config.go:350 msg="TLS is disabled." http2=false address=[::]:9100
Add the sport to your firewall-cmd and reload:
firewall-cmd --add-port=9100/tcp --permanent
firewall-cmd --reload
Lastly, clean up our mess!
rm -rf /opt/node-exporterTesting
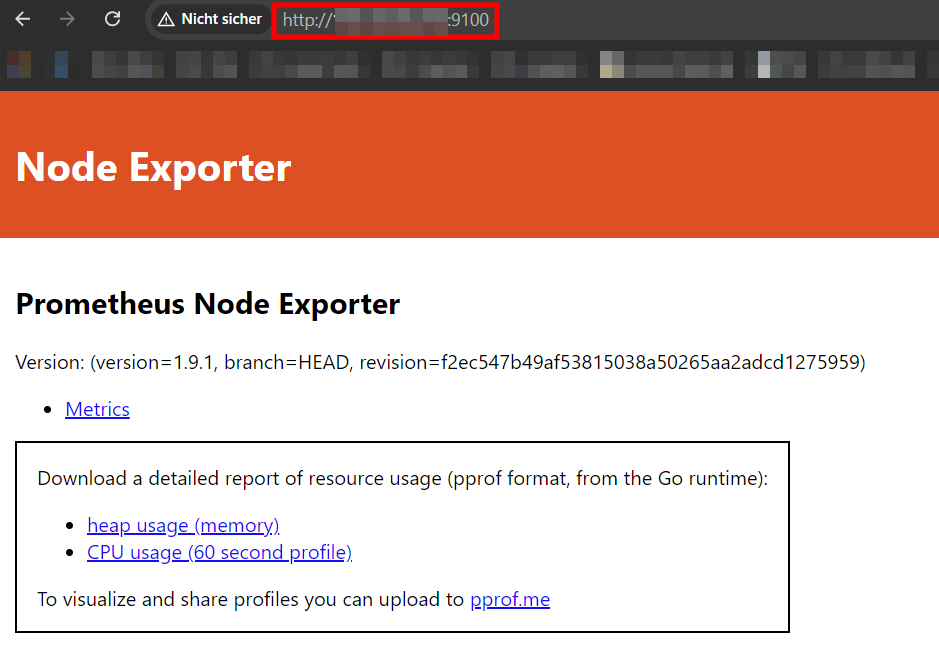
In your webbrowser when you navigate to the fqdn or ip of the system port 9100 you should see the node exporter ui:
http://systemip:9100/
On: http://systemip:9100/metrics you should see the scraped metrics:
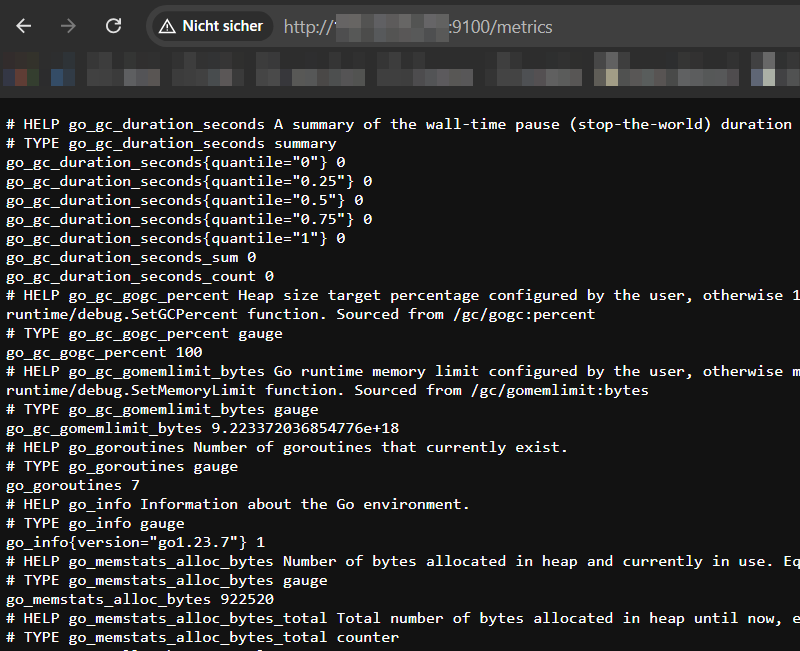
You can also test this via curl on the system or on your prometheus server:
root@Rocky10-Template1:~# curl http://localhost:9100/metrics
# HELP go_gc_duration_seconds A summary of the wall-time pause (stop-the-world) duration in garbage collection cycles.
# TYPE go_gc_duration_seconds summary
go_gc_duration_seconds{quantile="0"} 1.12e-05
go_gc_duration_seconds{quantile="0.25"} 1.12e-05
go_gc_duration_seconds{quantile="0.5"} 1.12e-05
go_gc_duration_seconds{quantile="0.75"} 1.12e-05
go_gc_duration_seconds{quantile="1"} 1.12e-05
go_gc_duration_seconds_sum 1.12e-05
go_gc_duration_seconds_count 1
[...]
Add to prometheus
In your prometheus config you can now add the host.
Example:
global:
  scrape_interval: 15s
  evaluation_interval: 15s

scrape_configs:
[...]
  - job_name: 'node_exporter'
    static_configs:
      - targets: ['yoursystemip:9100']   # <-- add your new system here
Further configuration
On the Node Exporter Github Page you can see the default options and how to exclude and include metrics: https://github.com/prometheus/node_exporter?tab=readme-ov-file#include–exclude-flags
What you scrape can be modified in your prometheus-service file at:
vim /etc/systemd/system/node-exporter.service[Unit]
Description=Node
Exporter After=network.target
[Service]
User=node_exporter
Group=node_exporter
Type=simple
ExecStart=/usr/local/bin/node_exporter --collector.systemd.unit-include # <-- Add additional arguments here like this
[Install]
WantedBy=multi-user.targetAfter modifying the service file you need to reload the systemctl daemon and restart the service:
sudo systemctl daemon-reload
sudo systemctl enable --now node_exporter